One telemetry pipeline, two streams: network flows and radio KPIs.
This case study shows how the same edge runtime shape can serve defensive network-flow scoring and AI-RAN KPI forecasting while keeping the measured claims tied to committed artifacts.
One pipeline, two telemetry streams.
The shared shape is typed records, no-leakage windows or lag features, a small ONNX model, and operator-reviewed output. The adapters change between network-flow records and radio KPI rows, but the analytics core stays the same.
The two streams belong together at an edge node because capacity pressure and attack behavior can look similar from one side of the system. The runtime has to separate what it can measure from what it can only advise.
The boundary is defensive only, advisory only, and no autonomous action.
What was built.
- Security repo: source-agnostic runtime, CSV replay fixture, GBM detector and Ridge forecaster exported to ONNX, Typer CLI, static evidence pack, Thor deployment package, and benchmark harness.
- AI-RAN repo: Non-RT RIC rApp pattern, KPM-style contracts, Ridge vs GBR vs MLP comparison on temporal splits, advisory A1 policy candidates, and ONNX exports of all three models.
Thor leads the evidence.
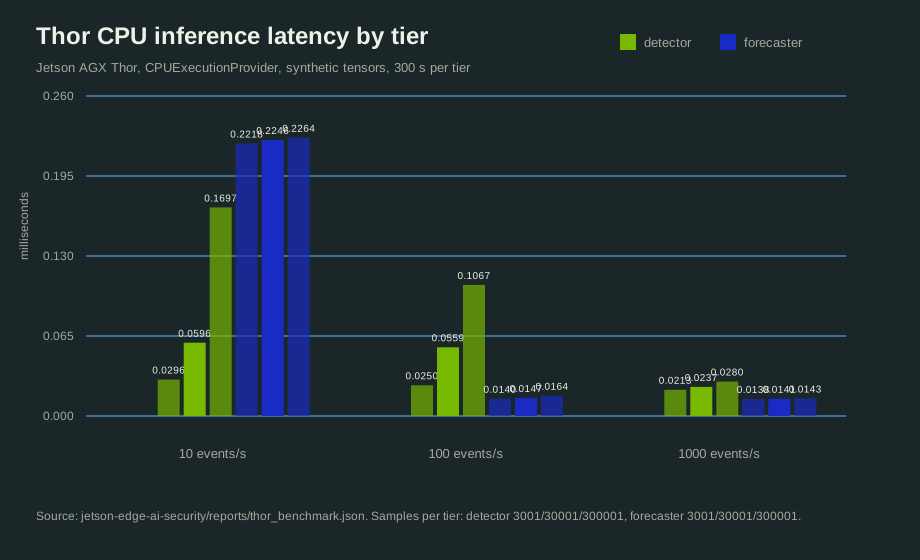
On 2026-09-08, run 3cac5ed2b7bd measured Jetson AGX Thor Developer Kit, tegra264, JetPack 7 / L4T R38.4.0, 120W mode, CPUExecutionProvider, synthetic tensors, batch 1, and 300 s per tier at 10, 100, and 1000 events/s. At the 1000 events/s tier, detector p95 was 0.0237 ms, forecaster p95 was 0.0141 ms, achieved rate was 1000.0 events/s, peak process RSS was 0.36 GB, and all four gates passed.
The CUDA provider failed on Thor with cudaErrorNoKernelImageForDevice using PyPI onnxruntime-gpu 1.29.0, with no JetPack 7 build on the NVIDIA index. The run fell back to CPU and recorded the provider error. The inputs were synthetic tensors, so this is inference cost, not capture performance.
The strongest result was a runtime setting.
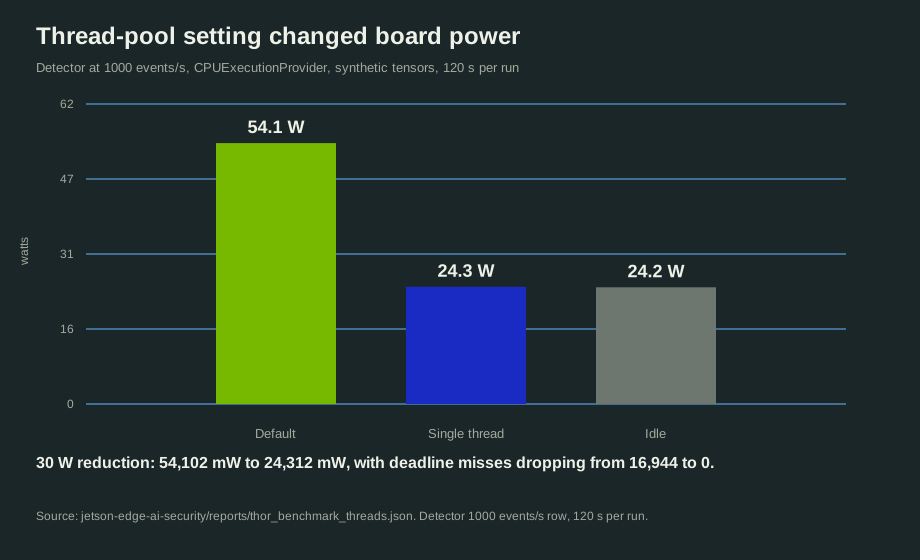
On the same Thor device, `reports/thor_benchmark_threads.json` compares run 1e430379de9b against run 42314e8252e9 with 120 s per tier. At 1000 events/s, the detector drew 54,102 mW with ONNX Runtime defaults and 16,944 pacing misses. With one intra-op thread, one inter-op thread, and spin waiting disabled, it drew 24,312 mW with 0 misses. The idle baseline was 24,212 mW.
The detector p95 changed from 0.0238 ms to 0.0219 ms, CPU rail p50 changed from 35,366 mW to 7,469 mW, and junction peak changed from 56.6 C to 40.4 C. The forecaster stayed within 0.2 W either way.
AI-RAN on the same runtime.
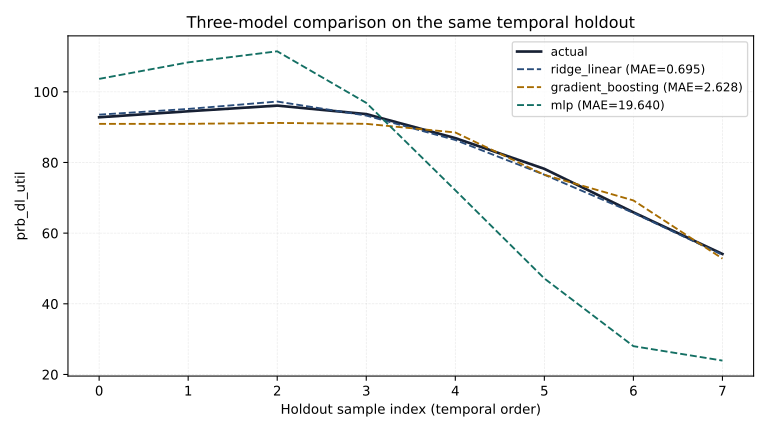
The AI-RAN repo is sample-data validation of the pipeline, not a forecast accuracy claim on public telecom data. On the 48-row synthetic sample, `reports/model_comparison/comparison_metrics.csv` records RMSE 0.84 for Ridge, 2.88 for GBR, and 22.6 for MLP.
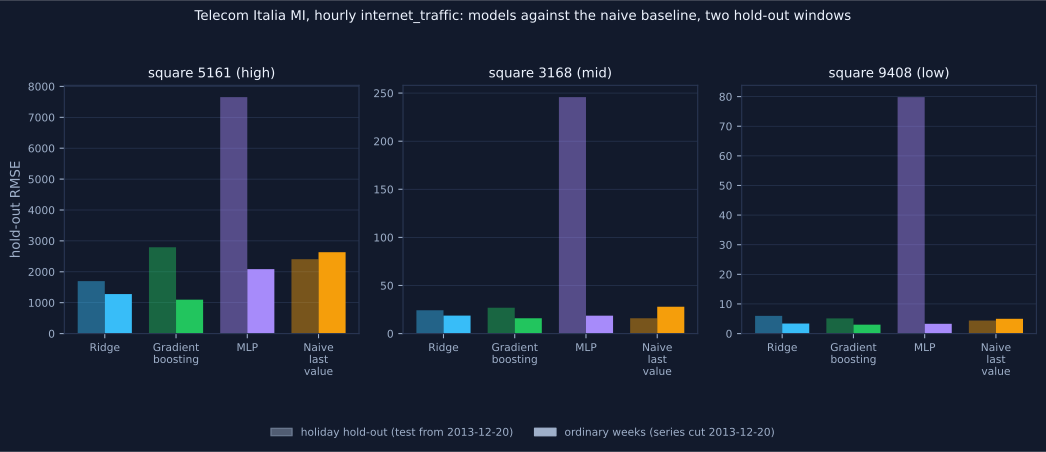
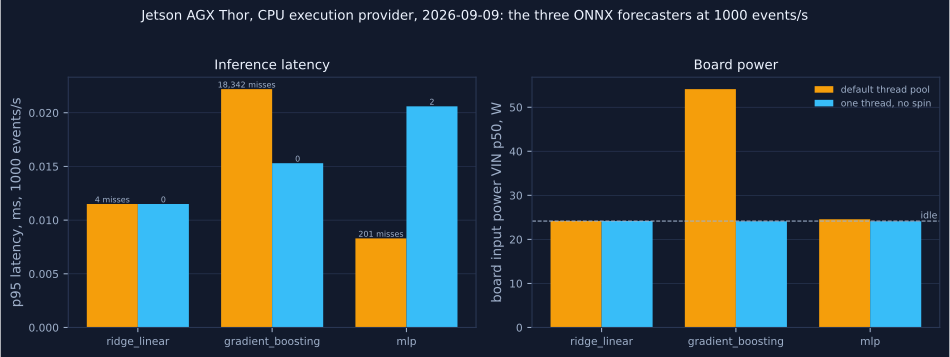
`models/exports/manifest.json` records ONNX exports for Ridge, GBR, and MLP with parity within 2e-5 on the sample rows. On the public Telecom Italia Milan grid (doi:10.7910/DVN/EGZHFV, 62 days, three squares by activity level, time-ordered split, 2026-09-09) the result depends on the hold-out window: in ordinary December weeks all three models beat a naive last-value baseline on every square, gradient boosting by the widest margin, while over the Christmas and New Year window the naive baseline beats them on two of three (`reports/forecast_examples/telecom_italia_mi/summary.json` and `telecom_italia_mi_preholiday/summary.json`). On Jetson AGX Thor, CPU provider, 2026-09-09, the three models ran at 1000 events/s with p95 0.0115 ms (Ridge), 0.0153 ms (GBR) and 0.0206 ms (MLP), zero to two deadline misses, one thread with spinning disabled; the default thread pool cost GBR about 30 W of board power and 18,342 misses (`reports/thor_benchmark/thread_comparison.json`). Inference cost only, not forecast accuracy.
What went wrong and what was corrected.
The Thor benchmark template originally carried Orin hardware fields: tegra-234, 64 GB, and JetPack 6. The harness also did not emit the gate block that the dashboard read, so a measured run would have rendered as not measured. Both were fixed before the first measured run.
The GPU provider failure is recorded rather than hidden. The artifact keeps the failed CUDA provider attempt, the cudaErrorNoKernelImageForDevice message, and the CPUExecutionProvider fallback.
What is not established.
- No detection-quality claim. All model metrics are on a synthetic fixture.
- No capture, flow-extraction, or packet-to-alert latency measurement.
- No sustained run beyond 300 s per tier.
- No GPU execution on this device.
- No forecast accuracy on public telecom data.
- No deployed rApp or live RIC.
Next work is WUSTL-IIoT-2021 evaluation with a non-random split, end-to-end latency on Thor, a 60-minute soak, the Telecom Italia MI run, and the AI-RAN Thor run.
Dashboards and evidence pages.
Every page below is generated from committed artifacts in its repository and served by GitHub Pages, so it opens rendered rather than as source. The security pages are rebuilt from the JSON records by the repo's report generator; the AI-RAN pages are rebuilt by its portal and publish targets.
Edge security
AI-RAN KPI forecasting
Sources and links.
Raw records, security: reports/thor_benchmark.json, reports/thor_benchmark_tegrastats.jsonl, reports/thor_benchmark_threads.json, reports/thor_threads/, reports/training_run.json, and docs/publication-plan.md.
Raw records, AI-RAN: reports/model_comparison/comparison_metrics.csv, models/exports/manifest.json, reports/forecast_examples/telecom_italia_mi/summary.json, and telecom_italia_mi_preholiday/summary.json.